How to simplify BPMN Data Models
Why simplifying your diagrams can actually make them more informative.
You’ve probably seen one of these ‘look at me’ diagrams. You may even have created one.
They are the big, colorful ones which sit over the desks of some modellers. They have loads of boxes, even more lines, and they are designed to say one thing.
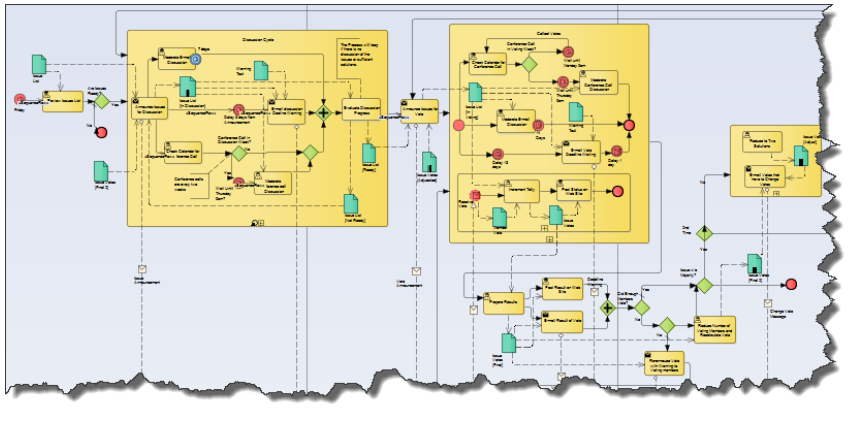
"Look at Me"
If they were just a harmless exercise in drawing, they wouldn’t be so bad. But you just know that they took someone hours and hours and hours to create. And someone paid for all that time
“Ah!” you say. “But the modeller needed this big diagram to give them an overall picture of what’s happening“.
But does it?
Can you really look at this diagram and see where something is missing? The example above is from the OMG’s BPMN modelling language, and is one of their demonstration examples, presumably to show what a great thing BPMN is.
But it’s a hopeless way of conveying information – which is one purpose of such a diagram – and shows lazy modelling. By lazy, I mean intellectually lazy. Not time-lazy, as it clearly took ages to create. The modeller chose not to use their knowledge and experience to chop the diagram into bits, so they they and their readers would have a chance of spotting the gaps, overlaps and inconsistencies.
Because this is what we’re supposed to be doing.
4 ways to spot you have a 'look at me' diagram
- You’re starting to feel that printing the diagram and putting on the wall near your desk will enhance your chances of promotion
- You’ve spent a hour on the internet looking for a device driver which will let you print it on a giant printer
- You found the driver, but not the giant printer, but you did find lots of sticky tape and glue in the stationary cupboard, so now you’re having loads of fun joining the bits together
- If you print the diagram as A4/Legal size, the writing is only visible with an electron microscope.
..and what to do about it
- Chop it into pieces.
That’s it. Simple.
Well, not always.
But this where we show our modelling skills. We’re the ones who are supposed to be able to pull all this knowledge into our heads, and write down a set of smaller, easier diagrams, which help a reader to work they way into the problem. This is our job.
More on ‘how to make diagrams readable’ in future posts.
So, if you get me in to your project to see what you’ve been modelling, and you have one of these diagrams over your desk, don’t expect me to be impressed.
Update - August 2020
A while back, I had some time to spare on a long train journey, and decided to take the example above the create some more useful diagrams from it.
As I was doing the simplification, I wrote down the decisions I was making as I did it:
- Split the diagram – Make it into at least 4 different diagrams, corresponding to the main clumps on the original picture
- Add some intermediate business events – Link the new top-level processes with Business Events, to show the sense of the process.
- Make separate diagrams to show where the Data Objects fit – There are too many of these, so have one diagram where they don’t appear, so readers can get the idea, then another where we add this additional detail.
- Remove multiplicities from Black Box and Data Object – Having the multiplicity symbol on the Voting Members black box is not helpful. The clue is in the name. Members plural. Just more notation to forget.
Also removed the multiplicity symbol form the Issues List. Apart from the fact there is only one list, not many, it’s obvious what this means. Symbolic clutter - Give parallel flows an explicit branching gateway – It’s not clear in the original where and why the ‘Announce Issues for Discussion’ Activity causes a parallel branch. As I added one, so we can see that only after it completed does the flow branch.
This might not be what the original modeller intended, but I think this is clearer. If it wrong, then it’s clear where to correct it.
So here is how I re-imagined this diagram.
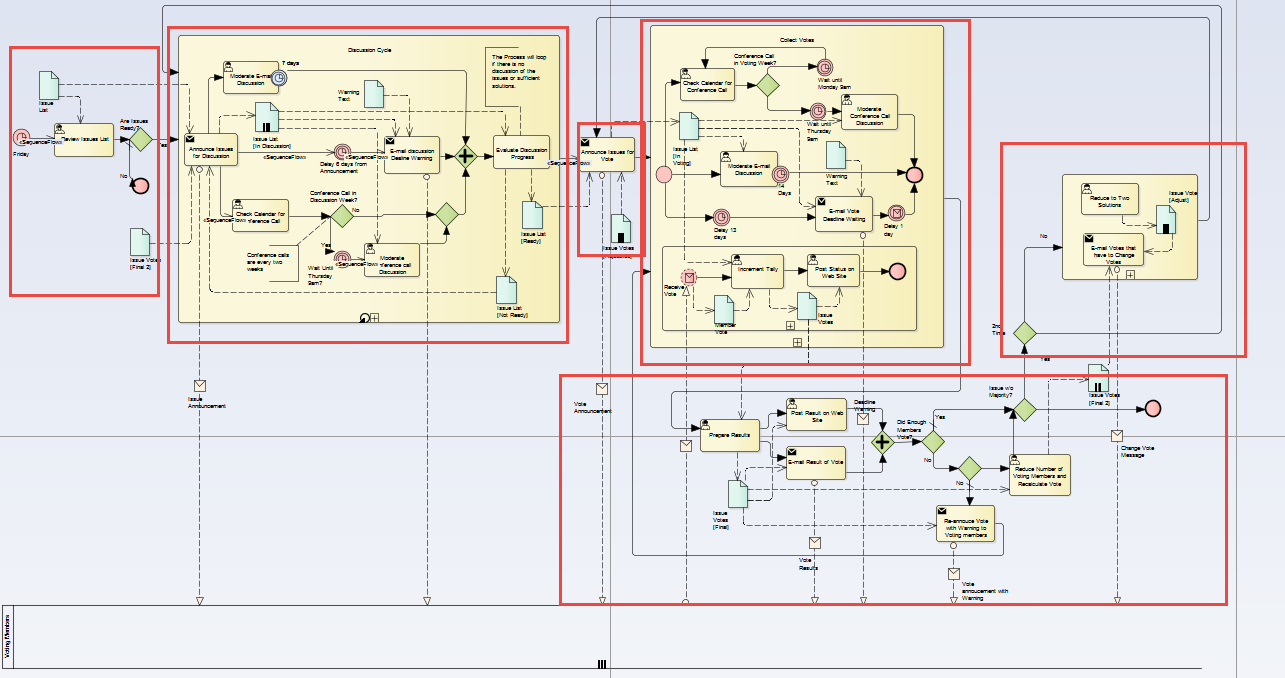
First I decided on a few initial ‘chunks’ and made those bits which weren’t already sub-processes into their own sub-processes.
Even the act of drawing the red boxes (which are just for illustration, not part of our model) makes the model easier to understand: the reader can start to concentrate on smaller bits, and not get intimidated by the whole.
Now we can start to make progress. Having decided that there are 6 big boxes, we can put just those bits into a new diagram, and hook them up with events:
To create this diagram, I’ve added EVEN MORE BOXES. This is ok – making stuff simpler doesn’t mean the same as making it smaller. I’ve chosen to link my top-level processes with Business Events (see process modelling with style), but it gives a sense of purpose and achievement to the overall process:
- stuff happens, which creates a business event (which we might expect a business person to understand),
- ..which in turn allows further processing to take place.
- …which results in another business event
It’s this kind of analytical thinking which is where we earn our living as modellers. Anyone can copy/paste boxes from one diagram to another. We’re adding-value and helping understanding. By the way – it took me quite a while to do this, and I kept the mega-diagram to make sure I’m not messing-up the overall picture.
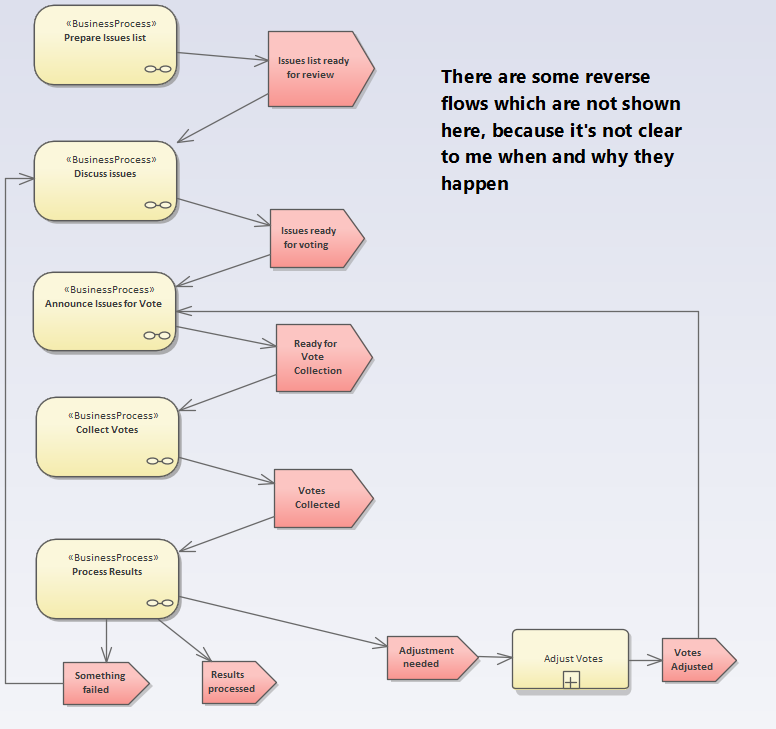
The Sub-Processes
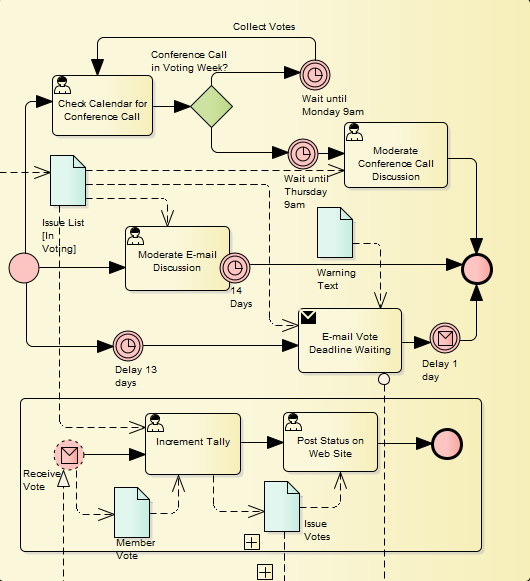
Now that we’re freed from the mega-diagram, re-organising the smaller ones isn’t so hard, but there’s still work to do.
If left un-edited, one of the boxes looked like this, which I found hard to understand, so I re-structured and re-drew it to look a bit simpler:
This diagram is simpler for a number of reasons:
1- I have removed some of the diagram elements, namely, the notes and the Messages, to the black box pools. These appear on another, similar diagram which has all the detail.
2 – I’ve added the business events (not part of BPMN) top left and bottom right, to show how the sub-process starts and ends. This immediately suggests that I may have forgotten something: the process has no error conditions. Something to look into…
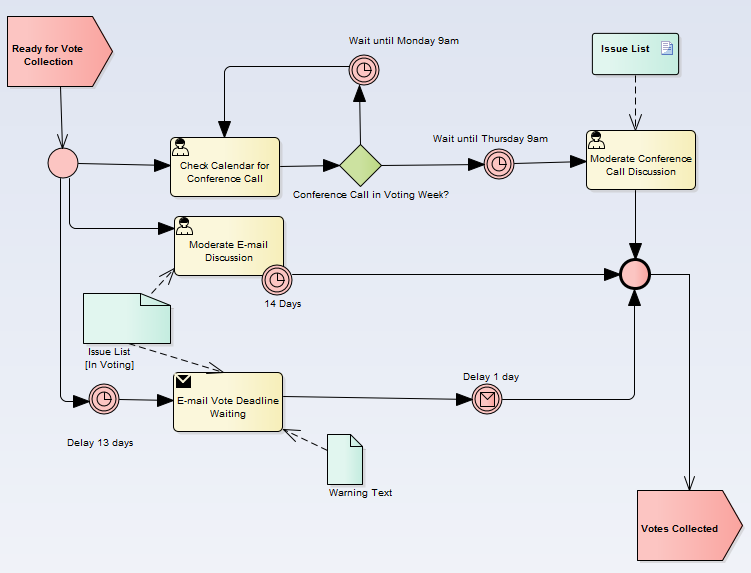
Simplifying things is Complicated
I probably spent a good few hours simplifying this process, but in doing so found lots of questions which I’d like to ask the authors. So that’s me doing my job of using the model to Analyze stuff .
At the end of it, I think I not only understand what they are trying to say, but I could also give someone a document which would help them to understand it too. It would have the top-level diagram, then the sub-process diagrams, and some additional diagrams with supporting details.
The process is then not just a big, clever-looking diagram which nobody understands. It’s been added to our collective knowledge. I don’t need the authors in order to understand it, nor a PhD in BPMN notation. Anyone who knows a little BPMN could understand it and even improve the process.
Job Done.
PS. If you’d like a copy of the ‘before’ and ‘after’ models (as an XMI file out of Sparx Enterprise Architect) then email me at ian at eadocx.com
More Insights
How does eaDocX Quick Document compare with the Sparx EA Built-In Auto-document feature?
13 November 2025
We asked ChatGPT to compare the two. This is what it said.
Learn MoreaiExpert In Practice - #4 - Data Model
7 November 2025
Shows a summary of the feedback on some parts of a large, public domain healthcare model from Canada
Learn MoreWhat are the differences between native EA document generation and eaDocX?
5 June 2025
Looking at usability, document formatting and control, content customization, maintenance and re-usability, automation and integration.
Learn MoreSide-by-Side comparison of documents generated using EA and eaDocX
5 June 2025
This example shows a document excerpt for a simple UML Class model with two classes (Customer and Order) and an association between them.
Learn MoreDocuments are dead - or are they?
19 October 2023
If your organization needs documents then you need eaDocX and Revision Manager - for quality documents, easy reviews and fast efficient model updates.
Learn MoreDocument-based EA model collaboration
27 September 2023
eaDocX and eaRevisionManager provide a cost effective and powerful solution for efficient document-based collaboration in Enterprise Architect.
Learn MoreWhy has eaDocX become eaTeamWorks?
27 September 2023
Here are the reasons why eaDocX is now part of eaTeamWorks - and why it's good for you.
Learn MoreCreating Custom Documents in Enterprise Architect 16
21 September 2023
Enterprise Architect 16 offers refined tools for customizable report-building. But sometimes you need even more. And fast. Here's how.
Learn MoreTraceability using Multi-hop Relationships
9 September 2021
Using eaDocX multi-hop relationships you can easily print the end points of 'virtual connectors' showing EA end-to-end traceability.
Learn MoreEnterprise Architect Tables: Using word table styles in EA
25 June 2021
This video shows how to apply Word table styles when you generate eaDocX documents from your Enterprise Architect models.
Learn MoreVideo Masterclass - Adding Detail to EA Matrix Reports with eaDocX
25 June 2021
With eaDocX you can format EA Matrix Reports in Word to include additional details and formatting. Here's how
Learn MoreVideo Masterclass - Creating documents from Model Views
25 June 2021
Use EA Model Views to create simple, flexible documents with eaDocX.
Learn MoreConditional Formatting Tool for Enterprise Architect
25 June 2021
Help readers find the things that need their attention, decisions and actions, with eaDocX conditional formatting.
Learn MoreVideo Masterclass - Attribute mapping with EA, eaDocX and Excel
25 June 2021
With eaDocX and Excel, it's easy to view, edit, create and even delete attribute/attribute links in Sparx EA.
Learn MoreEnterprise Architect Help: Choosing the right document structure
25 June 2021
eaDocX makes it easy to create exactly the document structure your readers need. Here's how...
Learn MoreEnterprise Architect User Guide - quick documents
22 June 2021
Video guides on how to create quick documents with EA's leading add-on, eaDocX.
Learn MoreDocuments in the Enterprise Architect Cloud
6 April 2021
eaDocX in the Cloud: Enterprise Architect document creating for EA SAAS environments
Learn MoreProducing Enterprise Architect RACI reporting
11 March 2021
Producing a RACI report from data held in EA, mapping stakeholders to any project deliverables is straightforward with eaDocX.
Learn MoreModels matter - nearly as much as deliverables
25 August 2020
Models matter - nearly as much as model deliverables
Learn MoreFixing your meta-model
25 August 2020
Advice for the new modeller #3 – Fixing your meta-model
Learn MoreKnowing when to give up
25 August 2020
Knowing when to step back makes for better Business Analysts
Learn MoreUsing Enterprise Architect to document decision making
25 August 2020
Make your models more useful for future modellers
Learn MoreExplaining EA Sparx Systems to non-modellers
25 August 2020
Model driven analysis - the best way to define what we do?
Learn MoreUML Business Analyst Solutions
14 August 2020
Using UML to resolve inconsistencies, gaps and overlaps.
Learn MoreCleaning: How to Simplify Enterprise Architecture Models
14 August 2020
Model Curation Techniques # 1 - Cleaning your EA model before you let other people see it
Learn MoreIncluding Sparx EA Model Provenance
14 August 2020
Sparx EA model help to explain to others why your models look the way they do.
Learn MoreWhat to include in your Enterprise Architect documentation
29 July 2020
How to create documents which communicate your ideas efficiently and effectively to stakeholders.
Learn MoreOrganising an Enterprise Architect Model
28 July 2020
Seven ways to organise your EA models so that other people can understand them
Learn MoreChoosing Your UML Subset
27 July 2020
Narrowing down the modelling ideas in your Enterprise Architect model to make consistent, understandable models.
Learn MoreWebinar: Using Interactive Documents to Collate Sparx EA Model Feedback
17 July 2020
A webinar from the EA Global Summit 2020.
Learn MoreWebinar: How to successfully scale up your Enterprise Architect team
30 June 2020
A webinar from the EA Global Summit 2020.
Learn MoreNavigating Models: Enterprise Architect Help and Techniques
16 April 2020
EA Model Curation Techniques #2 - Making models easy to navigate.
Learn MoreValidation: Improving your Enterprise Architecture Model Structure
16 April 2020
EA Model Curation Techniques #3 - Validating your model
Learn MoreModelling techniques for business architecture software to explain general patterns
16 April 2020
Using object diagrams to explain general patterns with specifics.
Learn MoreHow to create personalised documents using Sparx document generation tools
16 November 2018
A guide to creating documents from Sparx EA models so everyone can engage with your work, project or deliverables.
Learn MoreDocument or Enterprise Architect Views?
21 May 2018
Create documents to be used by non-EA users instead of model views.
Learn MoreImprove your enterprise architecture model using colour
25 April 2018
Careful use of colour and shape makes models easier to digest.
Learn MoreModel curation techniques for EA Sparx Systems
6 March 2018
How cleaning, navigating and validating your EA model makes sharing and collaborating much more effective.
Learn MoreThe most re-used model components in Sparx Enterprise Architect.
20 October 2017
Why is the project summary the most read element in an EA model?
Learn MoreCreating a Glossary: Business Analyst Terminology
12 October 2017
Streamline your business understanding with shared definitions.
Learn MoreBusiness Process Analyst Styles
11 October 2017
Find out if you are a 'hard' or 'soft' Business Analyst.
Learn MoreHow to Print Sparx EA Connectors
18 October 2016
Structure your documents using the connectors in your Sparx model.
Learn MoreUsing Multi-hop relationships to display Branch/Merge with EA13
11 August 2016
One of the most common requests we see from new EA users is: "Why can’t I do branch/merge with EA?
Learn More