Home / Model Expert Homepage / Model Expert Help / Getting Started / Understanding your model – the Package Dashboard
Import an MDG to create a Reference Model
Importing and exporting Reference Models
Editing RM Connector type properties
Stereotypes inheriting from other Element Types
Customizing Reference Model Properties
Customizing Reference Model Element Properties
Understanding your model – the Package Dashboard
Access
Project Browser > Select Package > Specialize / Model Expert / Package Dashboard
Creating a Package Dashboard
In the EA package browser window, choose a package you’d like to investigate. To start with, pick one with a small number of sub-packages and elements: maybe a few 10s of packages, and a few 100s of elements. This will just make exploring a bit faster.**
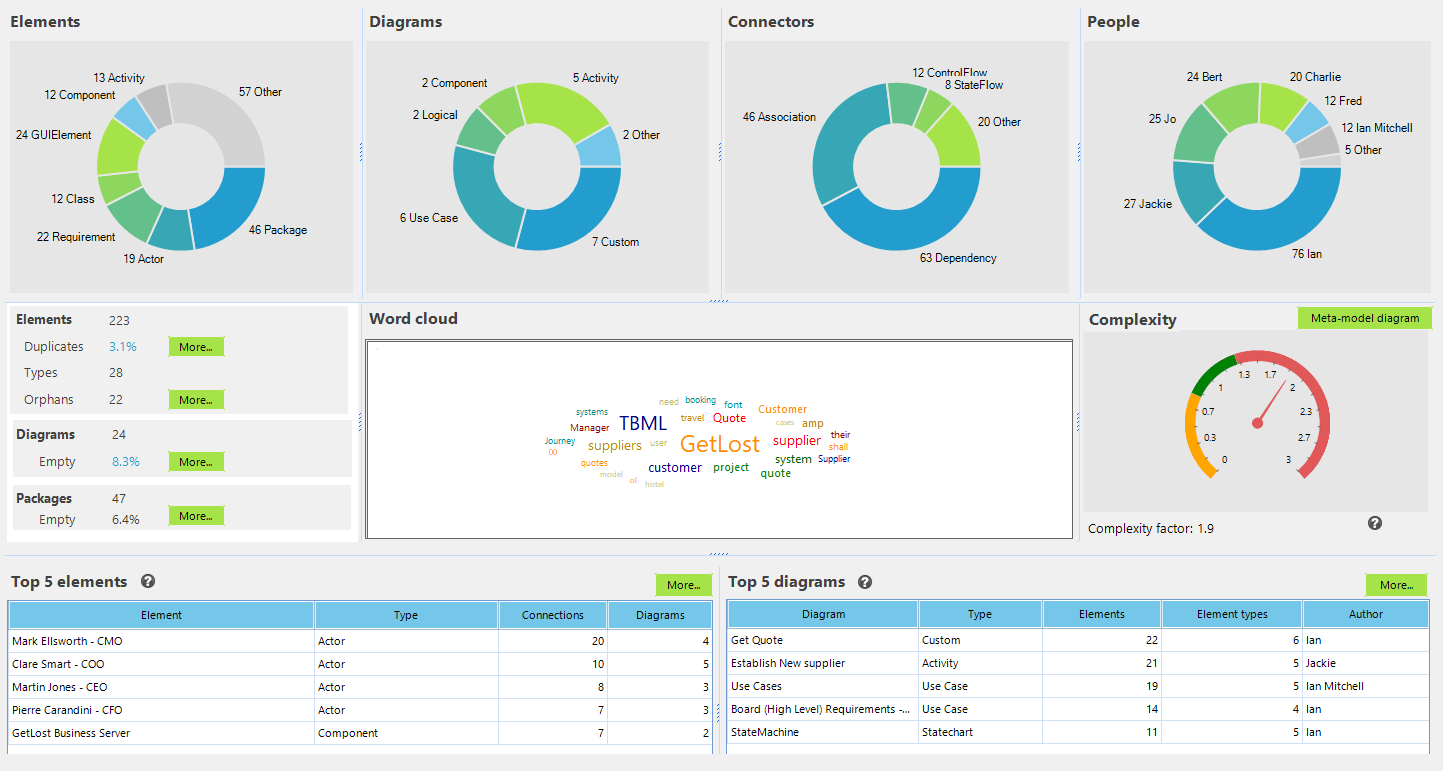
The Package dashboard opens in a new EA window, showing an analysis of the contents of your package.
It includes your package, it’s sub-packages and diagrams (but not individual elements – Model Expert is about managing models, not individual elements).
**- the Model Expert Dashboard looks deeply into your model, and can take quite a long time to fetch all the required data, so you should avoid trying to run it against very large packages, and certainly not against whole models.

Dashboard Contents
| Category | Description | See Also |
|---|---|---|
| Elements | Number and types of elements in the package
ACTION: Click on a segment on the chart to see a breakdown of elements of that type, and in each case, its:
Select an individual item in the list to find it in the project browser. INSIGHT: If your package has a large number of different types of element, this suggest you are looking at a complex bit of modelling. It might be hard to create a Reference Model from a package like this. Think about looking at the sub-packages instead. |
|
| Diagrams | Number and types of diagrams in the package
ACTION: Click on a segment on the chart to see a list of diagrams of that type, with for each diagram, how many elements and element types it contains, plus the author. Click on a single diagram in the list to open the diagram and find it in the project browser. INSIGHT: A package with lots of diagram types, especially types from un-related modelling languages or styles, means this is a complex package. Think about looking at the sub-packages. |
|
| Connectors | Number and types of connectors in the package
ACTION: Click on a segment on the chart to see a list of occurences – type, stereotype, MDG, metatype, source and target. INSIGHT: Lots of connector types are a good measure of the complexity of a package, and the style of modelling being used. |
Package Complexity |
| People | Shows the names of the authors of elements in the package.
ACTION: Click on a segment on the chart to see everything that this author has created: packages, element types and stereotypes, connectors and diagrams. Select an individual item in the list to find it in the project browser. INSIGHT: This shows who is doing most of the modelling in this package. If nothing else, this gives you an idea of who you should talk to to find out what’s happening in this part of the model. |
|
| Key Measures |
ACTION: Click through to show the duplicates, orphans, empty diagrams and empty packages INSIGHT: Empty diagrams are not necessarily bad, but they are often a sign that some part of the model is incomplete. |
Show & Fix Duplicate elements
|
| Word Cloud | This is a visual representation of the most commonly used words in this package (compiled from the Names and Notes fields only).
ACTION: Select a word in the cloud to get a list of the elements which contain that word, with their type, stereotype, location, and author. Click on a location to find the element in the project browser. |
Word Cloud |
| Complexity | The package complexity measure is a simple indication of the level of ‘connectedness’ of the meta-model of the package. It is the ratio of element types to connectors. Optimum is around 1.1.
ACTION: Select Meta-model Diagram to see the complexity of the model structure for this package displayed in a class diagram. |
Understanding your model – the Meta-model view |
| Top 5 Elements | This table shows the Elements in this package which have the most connections and appear in the most diagrams.
If you are looking for where to start understanding this model, then exploring those elements which are most highly connected, and which appear on most diagrams is a good place. The list is sorted by the number of connections multiplied by the number of diagram in which the the element appears. ACTION: Select More to show this information for all the elements in this package, sorted in the same way. |
|
| Top 5 diagrams | This table shows the most important diagrams in the package.
“Importance” is the number of elements in a diagram, multiplied by the number of element types in the diagram. So, a diagram with 50 elements, all of the same type (for example, Requirements) will show as less complex than a diagram which has 20 elements of 5 different types. ACTION: Select More to show this information for all the diagrams in this package, sorted in the same way. |
Snapshot View
The package dashboard is a snapshot view, so remember to re-generate it whenever changes are made to the package you are analyzing.