In the section Creating Reports, you saw how to take EA data, pull it into an Excel worksheet, then produce charts.
But if you are using eaDocX to create documents, you don't want to have to send your readers a document AND and spreadsheet. You would have to make sure that the document and the spreadsheet were both up-to-date, with the same version of your EA model. If you have a one-off report, which will never be used again or updated, the a simple copy/paste from Excel to your eaDocX Word document will be OK.
However, if, as with other eaDocX documents, it WILL be updated and used again, then it would be much clearer to put the charts into the documents, and have everything update together. That way, eaDocX can do the work, and add version information as it would for a normal eaDocX document.
If you have eaDocX Corporate Edition, then on the eaDocX | Insert | Report menu, you will have an additional option: Excel Report.
This allows you to add either a single Excel chart, or a single Excel Named Range. A named range is block of an Excel worksheet, to which you can give a name. It's a standard feature of Excel, but one you might not have used.
To add an eaXL Chart to your eaDocX Document:
1.Position your cursor in the eaDocX document, at a suitable place to add a section
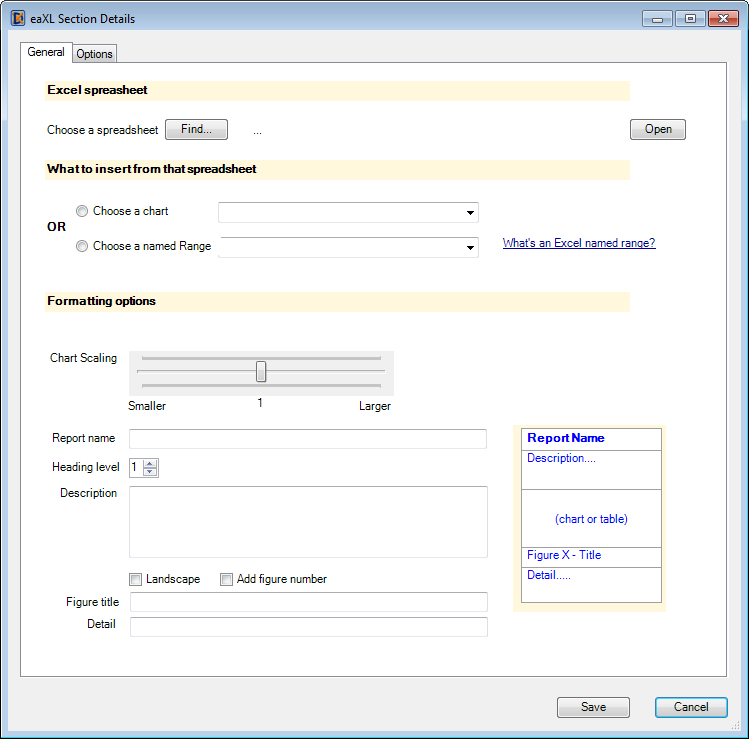
2.Select eaDocX | Insert | Report | Excel Report

Choose Spreadsheet |
'Find' to select the spreadsheet which contains the chart or named range you want to add |
|---|---|
'Open' opens that spreadsheet, to see what it contains |
|
Choose Chart or Named Range |
eaXL will show you the Charts and Named Ranges which are available in the Excel spreadsheet you chose above |
Formatting Options |
This section lets you choose what the chart/range looks like |
Chart Scaling (Charts only) |
Allows you to reduce or increase the size of the chart as it appears in the eaDocX Document. |
Report Name |
This will appear as a title, above the chart |
Heading Level |
Sets the heading level of the Report Name |
Description |
Free-form text. This will appear immediately below the Report Name, using the inline, paragraph text word style |
Landscape |
Tick this to make the whole eaDocX section appear in a Landscape-format page. This includes the Heading and figure number/description. Use this where charts or tables are especially wide, and can't be scaled-down |
Add figure number |
Puts a sequential figure number - consistent with the figure numbers used for EA diagrams - underneath the chart or named range. Uses the 'diagram style' word style |
Figure title |
Text which follows the Figure number. If 'figure number' is not selected, this will not be shown. Uses the 'diagram style' word style |
Figure detail |
Additional free-form text, added under the figure number and title. If 'figure number' is not selected, this will not be shown. Uses the 'diagram text' word style
|