You've seen how eaXL can pull-in all kinds of data from EA, and manipulate it.
But what about using eaXL to create reports?
The reports which you have seen so far are OK for editing data, but don't have lots of the features of Excel reports, such as totals, charts and diagrams.
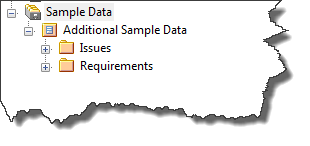
To show how this can work, we're going to need a bit more sample data, and we've provided some in the 'Get Lost' Sample project, in the 'Sample Data' view:

The 'Requirements' package contains some EA Requirement Elements with rather dull names, but have other attributes which makes them suitable as examples.
To illustrate how eaXL and EA can be used to create interesting reports, we have created an example. On eateamworks.com, download the 'Requirements Example' spreadsheet from the downloads area.
This takes a list of requirements from the 'Get Lost' Example model, and creates some charts from it.
When using eaXL to create charts and reports from EA data, we suggest the following. These are only suggestions, based on using eaXL, but they seem to produce accurate, reliable results:
1.Use separate Worksheets to catch the output from different parts of your model.
We tend to call these '(information) Source'. So, in the'Requirements Example' above, we have a worksheet which only captures the requirements, called 'Requirement Source'. This worksheet will get updated each time we do an 'export' of use its contents in a eaDocX document, so there's no point adding our own calculations and diagrams to it.
2.Keep the processing in a separate Worksheets.
We have another worksheet called 'Requirements Analysis' where the calculations are added
3.Allow for expansion.
When creating Excel formulas, allow for the 'Source' worksheet to expand or contract. When the Source worksheet gets updated, it may have more or fewer rows, so make your ranges really large, to allow for this. Otherwise, as new elements are added, your formula might not process them
4.Allow for data changes.
You control what data columns appear in the Source worksheet, but the content of each row depends on what elements are in your EA model. There might be no rows, lots, or the contents of a cell might change significantly between rows. Make sure your formula allows for this
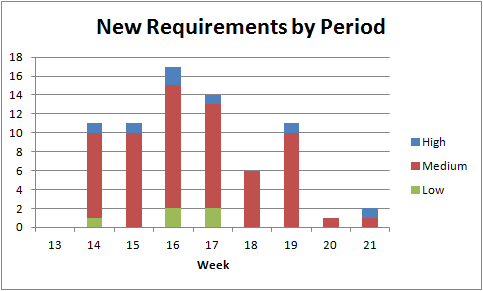
These are the example charts from the 'Requirements Example' spreadsheet:

These are the 'Requirement' elements, grouped by date & priority

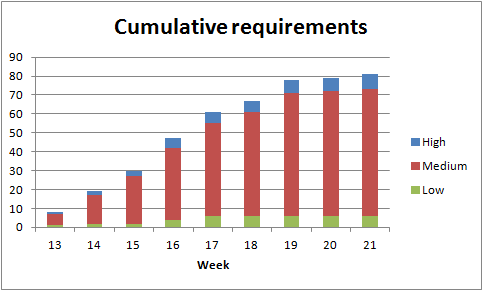
These are the same requirements, plotted cumulatively, to show that the number is starting to level off, which might indicate we're getting towards the end of the requirements gathering part of the project, and it's time to move on.

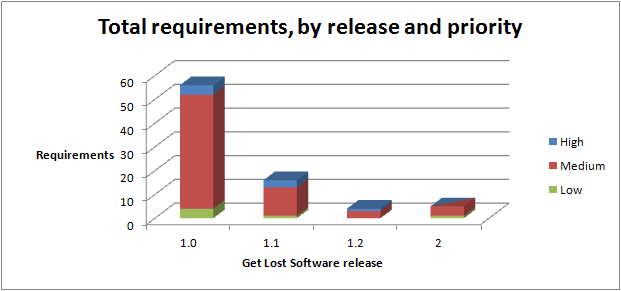
These are the same requirements again, but now split into their 'Release'.